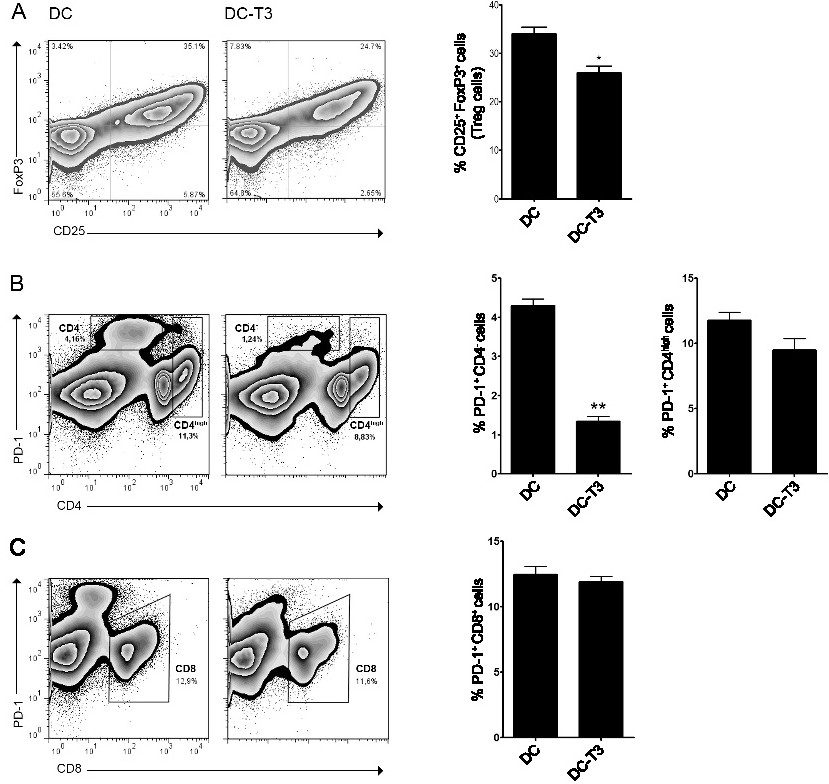
Fig. 4. Effect of T3-stimulated DCs on Treg cells and PD-1-expressing CD4 and CD8 cells. DCs were stimulated with T3 (5 nM, DC-T3) or left untreated (DC). After 18 h, they were cultured with allogenic splenocytes for 3 days. (A) CD4+ CD25+ FoxP3+ Treg cells were determined by flow cytometry. Values in representative density plots show the percentage of CD25+, FoxP3+ in CD4+ gated cells (A, left panel). Comparative analysis of CD25+ FoxP3+ cells within the CD4+ T cell population (A, right panel). (B, C) Expression of PD-1 on CD4 and CD8 cells was determined by flow cytometry. (B, C) Representative density plots show the percentage of PD-1 expressing CD4-, CD4high and CD8+ cells (B, C, left panel). Comparative analysis of cellular frequency (B, C, right panel). Data are expressed as mean ± SD and are representative of 3 experiments with similar results performed in triplicate, *p< 0.05, **p<0.01 vs control DC.